Observe the following bar graph and answer the following based on the data provided:
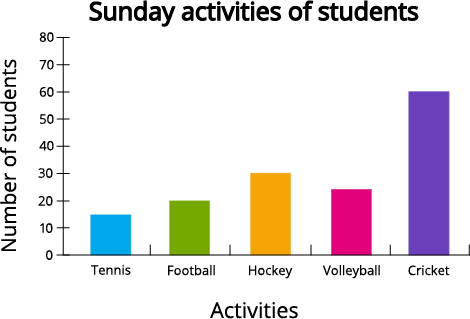
1. Which activity is least preferred?
2. The number of students who preferred football as a Sunday activity is .
3. The total number of students who preferred hockey and volleyball is
4. What is the difference in the number of students who preferred cricket and tennis?