Solution of a linear equation in two variables:
A point \((x,y)\) which satifies the equation \(ax+by+c=0\) is called the solution of the equation.
Also, the linear equation in two variables has infinitely many solution.
Example:
\(2x-3y = 5\)
Here \((-2,3), (0,\frac{-5}{3})\),... etc are the solutions of the above equation.
Slope and y - intercept:
The slope or gradient of a line is a measure of the slope or the steepness of the line. The steeper the line, the greater the slope.
In general, a line sloping up to the right has positive gradient while a line sloping down to the right has a negative gradient.
(i) General form of linear equation in two variables is,
\(y = mx+b\)
where \(m\) is the slope and \(b\) is the y - intercept.
Example:
\(y = 2x + 4\)
Comparing the above equation with \(y=mx+b\) we get,
Slope, \(m = 2\) and
y - intercept, \(c = 4\)
(ii) Slope of the vertical line, \(x =a \) is undefined.
(iii) Slope of the horizontal line, \(y=a\) is always \(0\)
Graph of a linear equation in two variables:
If we draw a graph of the given equation, then
(i) Every point whose coordinates satisfy the equation lies on the staright line in the graph.
(ii) The point \((a,b)\) lies on the line is a solution \(x = a,\) \(y = b\) of the given equation.
(iii) Any point which does not lie on the line is not a solution of the given equation.
To draw a graph of a linear equation in two variables \(ax+by+c =0\) we proceed as below:
(i) Express \(y\) in terms of \(x\)
(ii) Give any three convenient values of \(x\) to get the values of \(y\).
That is to get a ordered pair as: \((x_1, y_1), (x_2, y_2), (x_3,y_3)\)
(iii) Plots these points on a graph paper and draw a line passing through these points.
This line required graph of the equation \(ax+by+c=0\).
Example:
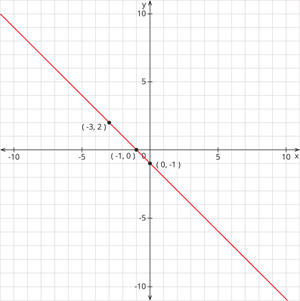
Graph the linear equation \(x+y+1=0\)
Solution:
Rewritting the given equation as follows,
\(y = -1 -x\)
Substitute \(x=-3\)
\(y = - 1 - (-3) = -1 +3 = 2\)
Substitute \(x = -1\)
\(y = - 1 - (-1) = - 1 + 1 = 0\)
Substitute \(x = 0\)
\(y = 1 - 0 = 1\)
Thus it forms, \((-3,2), (-1,0), (0,1)\)
Plotting these points on the graph and connecting them to get a line.