

1. What is probability?
Probability is a measure of how likely an event is to happen. It tells us the chance or likelihood that an event will occur. Just as we measure:
- Length in metres,
- Mass in kilograms,
- Time in seconds,
We measure uncertainty using probability.
Example:
- Will India win the cricket match today?
- Will I get \(80\) marks in Mathematics?
- Will I get a head if I toss a coin?
We cannot predict these events with complete certainty. Probability helps us estimate how likely they are.
2. Basic terms of probability
Event:
An event is something that may or may not happen.
Example: Rolling a \(5\) on a die, Drawing a red ball from a bag.
Chance:
Chance means the possibility that an event will happen. A higher chance means the event is more likely to occur.
Example: The chance of the Sun rising tomorrow is very high.
Random event:
A random event is something that could turn out in more than one way, and we cannot say for certain in advance which way it will go.
Example: whether it rains tomorrow, or whether your team wins a match.
Randomness:
Refers to any situation or action where the exact result cannot be predicted with \(100 \%\) certainty. While you might know all the possible outcomes, you cannot declare which one will definitely happen on a single try.
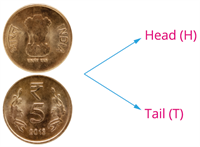
Example: Tossing a coin → you know the outcome will be heads or tails, but not which one.
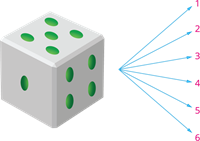
Rolling a die → you know it will be one of \(1\) to \(6\), but not which number.
Random observation/Random experiment:
An experiment or trial (also called a random observation) is an action you can repeat, where the result may be different each time and cannot be predicted in advance.
Example: tossing a coin, rolling a die, drawing a card — each time you repeat the action, you might get a different result.
Outcome:
The actual result of one performance of an experiment.
Example: Getting a head when a coin is tossed.
Sample space:
The complete list of all possible outcomes of an experiment. Each outcome should appear only once. The number of outcomes in the sample space is called the sample size and is denoted by \(n(S)\).
Example: Coin toss: \(\text{Sample space} = \{H,T\}\)
Rolling a die: \(\text{Sample space} = \{1, 2, 3, 4, 5, 6\}\)
3. Probability scale
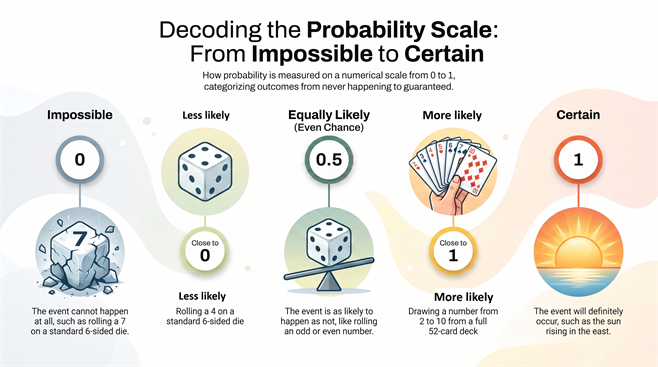
Important!
| Probability scale | Event |
| \(0.25\) or close to \(0\) | Less likely/low |
| \(0.75\) or close to \(1\) | More likely/high |
4. Measuring probability objectively
There are two main methods for calculating probability without relying on personal opinion (where someone simply guesses the likelihood based on personal judgment, e.g., "It looks cloudy, so it will probably rain").
(a) Experimental probability
(b) Theoretical probability
(A) Experimental probability
Experimental probability is calculated by actually performing an experiment (or using recorded data) and observing how often an event occurs. In statistics and data analysis, experimental probability is often referred to as relative frequency.
\(\text{Experimental probability} = \frac{\text{Number of times the event occurred}}{\text{Total number of trials}}\)
Example: If a die is rolled \(20\) times and it lands on \(1\) exactly \(10\) times. What is the experimental probability?
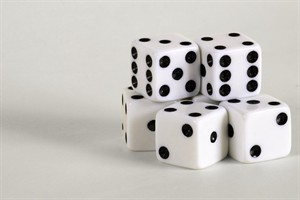
Experimental probability of rolling a \(1\) is \(\frac{10}{20}\) \(= 0.5\) or \(50 \%\)