Login
Home
TOP
Send feedback
Login
Subjects
Maths CBSE Live product
Class 9 (2025-26)
Statistics
Graphical Representation of Data - Histogram, Bargraph
4.
Answer the questions
Question:
3
m.
Have a look
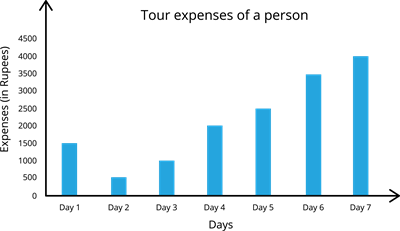
at the bar graph and answer the below given questions
:
1
.
What is the least amount that was spent during the whole tour?
1000
250
500
2
.
What was the amount spend on Day \(6\)?
3500
3400
3300
Login
or
Fast registration
Previous task
Exit to the topic
Next task
Send feedback
Did you find an error?
Send it to us!