

The School Pupil Leader (SPL) is the elected student representative of the school who is responsible for organizing events on campus. For the upcoming Annual Sports Day, the SPL requested the class representatives to submit reports on the student's favourite sports in each class.
Based on the collected data, the SPL constructed the following bar graph to represent the data:
Based on the collected data, the SPL constructed the following bar graph to represent the data:
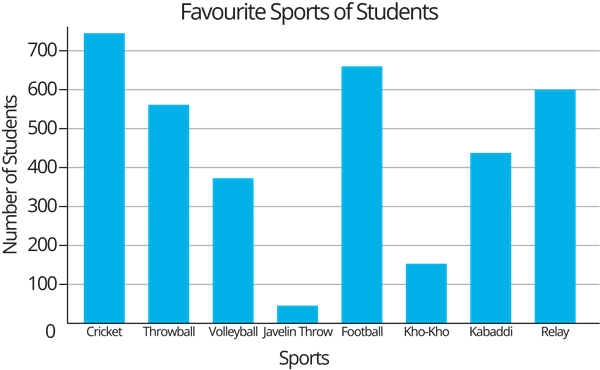
On the basis of the above information, solve the following questions.
1. Why a bar graph is used to represent the collected data?
2. Which sport is liked by maximum number of students?
3. Which two sport have equal number of votes?
4. Find the range for the given data?