

Rainfall is very important for agriculture, water supply, and climate studies. For the analysis of a city's rainfall pattern, meteorologists gathered daily rainfall data (in \(mm\)) for the month of July. The data is classified into the following class intervals:
| Rainfall range (\(mm\)) | Number of days |
| \(0 - 10\) |
\(6\)
|
| \(10 - 20\) | \(9\) |
| \(20 - 30\) | \(10\) |
| \(30 - 40\) | \(3\) |
| \(40 - 50\) | \(2\) |
The frequency polygon is drawn by plotting the class marks against the frequencies and connecting the points with straight lines.
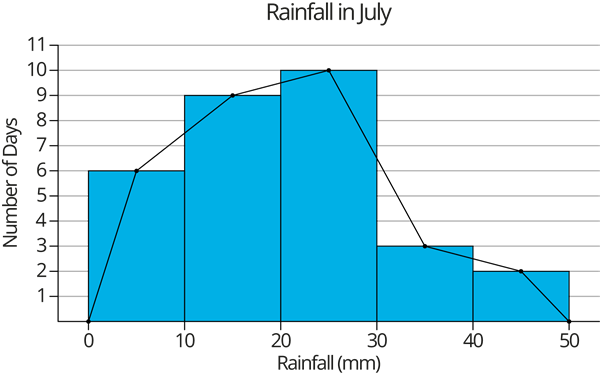
Based on the given data, answer the following.
1. What is the class mark of the rainfall interval \(20 - 30\) \(mm\)?
2. Which rainfall interval has the highest frequency?
3. How many days of rainfall has been recorded totally?
4. From the frequency polygon, what is your interpretation of the pattern of rainfall in July?