

Weather plays a vital role in human life since temperature fluctuations have a direct impact on health, normal daily routines, farming, transportation, and energy demand. Meteorologists, hence, keep precise records of climatic conditions to give accurate predictions and identify long-term patterns.
The table below illustrates the frequency distribution of maximum daily temperatures taken in a particular city for the month of August:
The table below illustrates the frequency distribution of maximum daily temperatures taken in a particular city for the month of August:
| Temperature | Number of days |
| \(15^{\circ} C - 20^{\circ} C\) | \(1\) |
| \(20^{\circ} C - 25^{\circ} C\) | \(6\) |
| \(25^{\circ} C - 30^{\circ} C\) | \(17\) |
| \(30^{\circ} C - 35^{\circ} C\) | \(5\) |
| \(35^{\circ} C - 40^{\circ} C\) | \(2\) |
| Total | \(31\) |
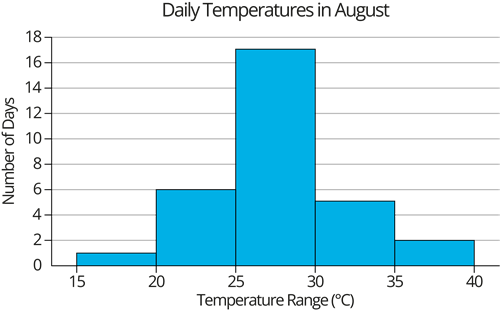
Using the above statistical data, answer the following questions:
1. On what percentage of days did the temperature fall between \(25^{\circ} C\) and \(30^{\circ} C\)?
1. On what percentage of days did the temperature fall between \(25^{\circ} C\) and \(30^{\circ} C\)?
2. How many days experienced a extremely hot temperature?
3. If a "hot day" is defined as a day with a temperature \(\geq 35°C\), what fraction of August days were hot?
4. What proportion of the total days did the temperature fall below \(25^{\circ} C\)?