

Analyse the following graph and answer the following question:
The velocity-time graph from \(0\) \(s\) to \(120\) \(s\) for a cyclist is shown in the below given figure. Identify the areas representing the displacement of the cyclist.
(i) While cyclist is moving with constant velocity.
(ii) When the velocity of cyclist is decreasing.
Also, calculate the displacement and average acceleration in the \(120\) \(s\) time interval.
(i) While cyclist is moving with constant velocity.
(ii) When the velocity of cyclist is decreasing.
Also, calculate the displacement and average acceleration in the \(120\) \(s\) time interval.
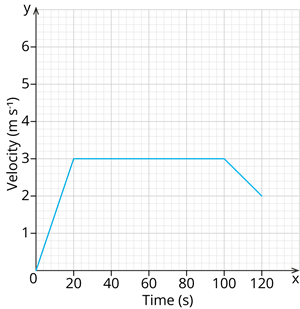
1. While analysing the cyclist's velocity–time graph, a student notices that the graph becomes horizontal for a certain interval. Which statement best describes the cyclist's motion during this interval?
2. The displacement when the velocity is decreasing is represented by:
3. The total displacment during the \(120\) \(s\) time interval \(=\) \(m\)
4. The average acceleration during the \(120\) \(s\) time interval \(=\) \( ms^{-2}\)