

Motion:
An object is said to be in motion if its position changes with time with respect to a reference point.
Examples:
- A bus travelling on a road.
- A person walking towards the classroom.
- A cricket ball rolling on the ground.
Distance and Displacement:
These are the two quantities used to describe how far an object has moved.
| Distance | Displacement |
| Total length of the actual path travelled. | Shortest straight-line distance between the initial and final positions with direction. |
| Scalar quantity | Vector quantity |
| Never negative | Can be positive, negative or zero |
| Always greater than or equal to displacement | Never greater than distance |
| SI Unit: \(metre (m)\) | SI Unit: \(metre (m)\) |
Average Speed and Average Velocity:
Average Speed:
Average speed tells us how fast an object moves during the entire journey.
\(Average\ speed= \frac{Total\ distance}{Total\ time}\)
SI Unit \(= m/s\)
Since distance is always positive, Average speed is always positive.
Average Velocity:
Average velocity tells us how quickly the displacement changes with time.
\(Average\ velocity= \frac{Total\ displacement}{Total\ time}\)
SI Unit \(= m/s\)
Average velocity depends on both magnitude and direction.
If the object returns to its starting point,
- Distance is not zero
- Displacement becomes zero
Therefore,
\(Average\ velocity\ =\ 0\)
while,
Average speed is not zero.
Average Acceleration:
Acceleration tells us how quickly the velocity changes with time.
\(Average\ acceleration= \frac{Change\ in\ velocity}{Time\ taken}\)
SI Unit \(=\) \(m/s^{2}\)
Positive acceleration \(\rightarrow\) velocity increases.
Negative acceleration (deceleration) \(\rightarrow\) velocity decreases.
Zero acceleration \(\rightarrow\) velocity remains constant.
Instant of Time and Time Interval:
Instant of Time:
An instant of time is a single moment at which an observation is made.
Example:
- The speed of a car at \(10\ s\).
- The position of a runner at \(25\ s\).
Time Interval:
A time interval is the duration between two instants of time.
Example:
From \(10\ s\) to \(20\ s\)
\(Time\ interval\) \(=\ 10\ s\)
Speedometer and Instantaneous Velocity:
A speedometer measures the instantaneous speed of a vehicle.
It tells us the speed at a particular instant of time, not the average speed of the entire journey.
If the speedometer changes from \(30\ km/h\) to \(60\ km/h\), it means the vehicle is moving with changing speed (non-uniform motion).
Since it does not provide the total distance travelled or total time taken, it cannot be used to calculate average speed.
Graphical Representation of Motion:
Graphs provide a visual representation of motion, making it easier to understand how an object's position or velocity changes with time.
(A) Position–Time Graph:
It shows how the position of an object changes with time.
Position–Time Graph:
A position–time graph shows how the position of an object changes with time.
Physical Quantities Obtained from a Position–Time Graph:
- Position of the object at any instant of time.
- Displacement between any two instants by finding the change in position.
- Velocity from the slope (gradient) of the graph.
- Nature of motion (uniform motion, non-uniform motion, or rest).
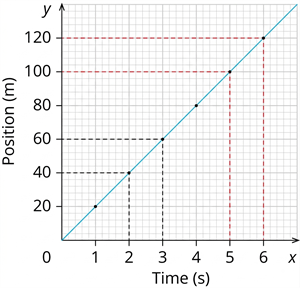
1. Straight Line with Constant Positive Slope:
- The object covers equal displacements in equal intervals of time.
- The velocity remains constant.
Represents: Uniform Motion (Constant Velocity)
Constant velocity
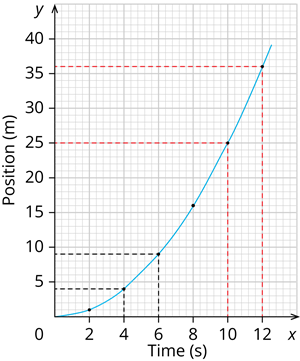
2. Curved Line Becoming Steeper
- The object covers greater displacements in equal intervals of time.
- The velocity increases continuously.
Represents: Accelerated (Non-uniform) Motion
Changing velocity
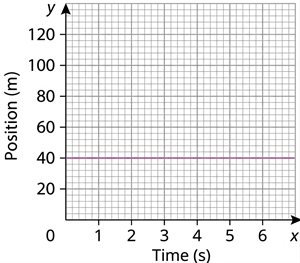
3. Horizontal Line
- The position remains constant with time.
- There is no change in position.
Represents: Object at Rest (\(Velocity\ =\ 0\))
Zero velocity
Velocity–Time Graph:
A velocity–time graph shows how the velocity of an object changes with time.
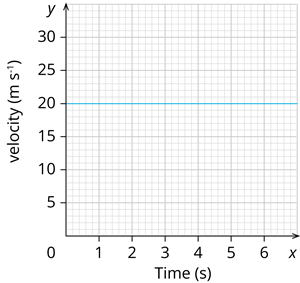
1. Horizontal Line:
- Velocity remains constant throughout the motion.
- The slope is zero.
Constant velocity
Represents:
- Constant Velocity
- Zero Acceleration
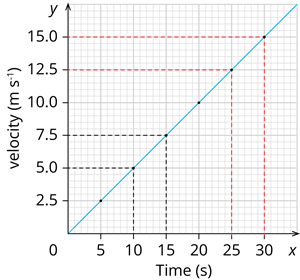
2. Straight Line Sloping Upwards:
- Velocity increases uniformly with time.
- The slope is positive and constant.
Increasing velocity with constant acceleration
Represents:
- Uniformly Accelerated Motion
- Positive Constant Acceleration
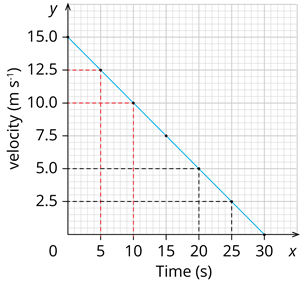
3. Straight Line Sloping Downwards:
- Velocity decreases uniformly with time.
- The slope is negative and constant.
Decreasing velocity with constant acceleration
Represents:
- Uniformly Decelerated Motion
- Negative Constant Acceleration (Retardation)
Understanding the Area Under the Graph:
The area enclosed between the velocity–time graph and the time axis gives the displacement.
- Rectangle \(\rightarrow\) Displacement during constant velocity
- Triangle \(\rightarrow\) Displacement during uniform acceleration or deceleration
- Trapezium \(\rightarrow\) Displacement when velocity changes uniformly but remains positive