Identify the graph from (a) and (b), which one corresponds to a male voice and state the reason for the choice.
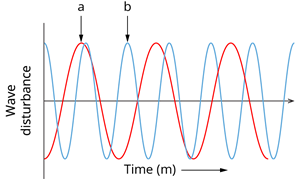
Generally the male voice has as compared to female voice.
As the time period of wave represented by graph (a) is that of graph (b). So, graph (a) represents wave than graph (b).
Hence, is likely to be the male voice.