Histograms:
Histograms are one way of graphically representing a grouped data or continuous data.
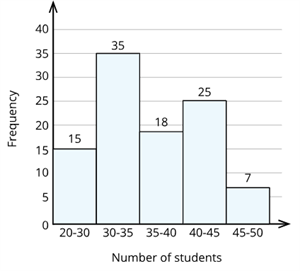
Histograms are made of a set of rectangles. The X -axis will have the different ranges of continuous data, and Y -axis will have the frequency.
Construction of histogram:
A private organization surveyed hundred schools in Chennai. The organization collected the average number of kindergarten children in each classroom.
The data table looks like this:
|
Number of students
|
25 - 30
|
30 - 35
|
35 - 40
|
40 - 45
|
45 - 50
|
|
Frequency
|
15
|
35
|
18
|
25
|
7
|
Now, let us try to construct a histogram.
Step 1 : Set and mark the units for X -axis and Y -axis.
Step 2 : Now mark the class intervals (Number of students) along the X -axis and the frequency along the Y -axis.
Step 3 : Now, construct rectangles with class intervals (number of students) as the base and the frequency as the height.
Here, the axes will look like this:
Measures of central tendency:
The measures of central tendency are the value that tends to cluster around the middle value of the given set of data.
The measures of central tendencies are:
- Mean
- Median
- Mode
Mean
Mean is defined as the sum of all the observations divided by the total number of observations. It is usually denoted by x¯ (x bar).
Therefore, mean \(\frac{\text{Sum of all the observations}}{\text{Total number of observations}}\)
If the number of observations is very long, it is a bit difficult to write them. Hence, we use the Sigma notation \(\sum\) for summation.
That is, , where \(n\) is the total number of observations.
Also, in the case of ungrouped frequency distribution, the formula to find the mean is given by:
Median
Median is defined as the middle value which exactly divides the given set of observations into two equal parts.
- If the number of observations (\(n\)) in the data set is odd, then the median can be determined using the formula, \((\frac{n+1}{2})^{th}\) observation.
- If the number of observations (\(n\)) in the data set is even, then the median is the mean of the values \((\frac{n}{2})^{th}\) and \((\frac{n}{2}+1)^{th}\) observations.
Mode
Mode is defined as the number which most frequently occurs in the given set of data. That is, the observation having the maximum number of frequency is called as mode.