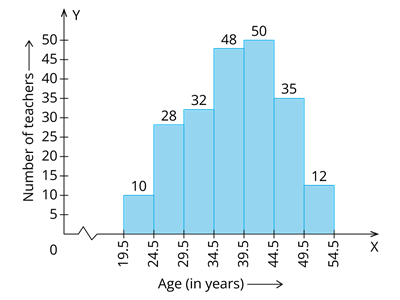
Construct a histogram to illustrate the following grouped frequency distribution:
| Ages (in years) | Number of teachers |
| \(20 - 24\) | \(10\) |
| \(25 - 29\) | \(28\) |
| \(30 - 34\) | \(32\) |
| \(35 - 39\) | \(48\) |
| \(40 - 44\) | \(50\) |
| \(45 - 49\) | \(35\) |
| \(50 - 54\) | \(12\) |
Solution:
The given classes are series. Let us convert them into a series.
Consider the classes \(1\) and \(2\).
Class \(1\) ends with \(24\), and class \(2\) begins with \(25\).
The distance between classes \(1\) and \(2\) \(= 25 - 24 = 1\).
Lower boundary of class \(20 - 24\) \(= 20 - \frac{1}{2}(1)\)
\(= 20 - 0.5 = 19.5\)
Upper boundary of class \(20 - 24\) \(= 24 + \frac{1}{2}(1)\)
\(= 24 + 0.5 = 24.5\)
Therefore, the updated limit of class \(1\) is \(19.5 - 24.5\).
We get the continuous frequency distribution table by applying the concept to the remaining classes.
The histogram of the above data is: