1. The frequency distribution:
| Marks | \(0 - 20\) | \(20 - 40\) | \(40 - 60\) | \(60 - 100\) |
| Number of students | \(10\) | \(15\) | \(20\) | \(25\) |
has been shown graphically as follows:
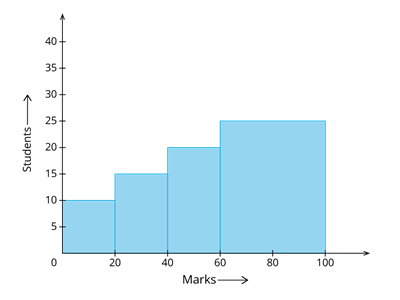
Which of the following best describes a correct histogram?
2. Is the following statement true?
“ In a histogram, the area of each rectangle is proportional to the frequency of the corresponding class interval.”