Login
Home
TOP
Send feedback
Login
Subjects
Physics CBSE Live product
Class 9 (2026-27)
Sound Waves: Characteristics and Applications
Energy, Graphical Representation & Wave Characteristics
4.
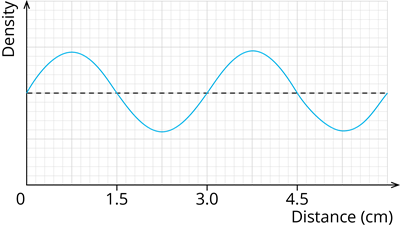
Distance - density graph
Question:
2
m.
Read the following graph and answer the questions given below:
1.
If the horizontal axis of the given graph represents distance, which of the following represents the wavelength of the sound wave?
Distance from the first crest to the mean position
Distance from the first trough to the second crest
Distance between the two successive crests
Distance from the first crest to the nearest trough
2.
In the given graph, the amplitude of the wave is represented by:
The maximum vertical displacement from the mean position
The horizontal distance between two troughs
The horizontal distance between two crests
The number of complete waves shown
Login
or
Fast registration
Previous task
Exit to the topic
Next task
Send feedback
Did you find an error?
Send it to us!